Abstract
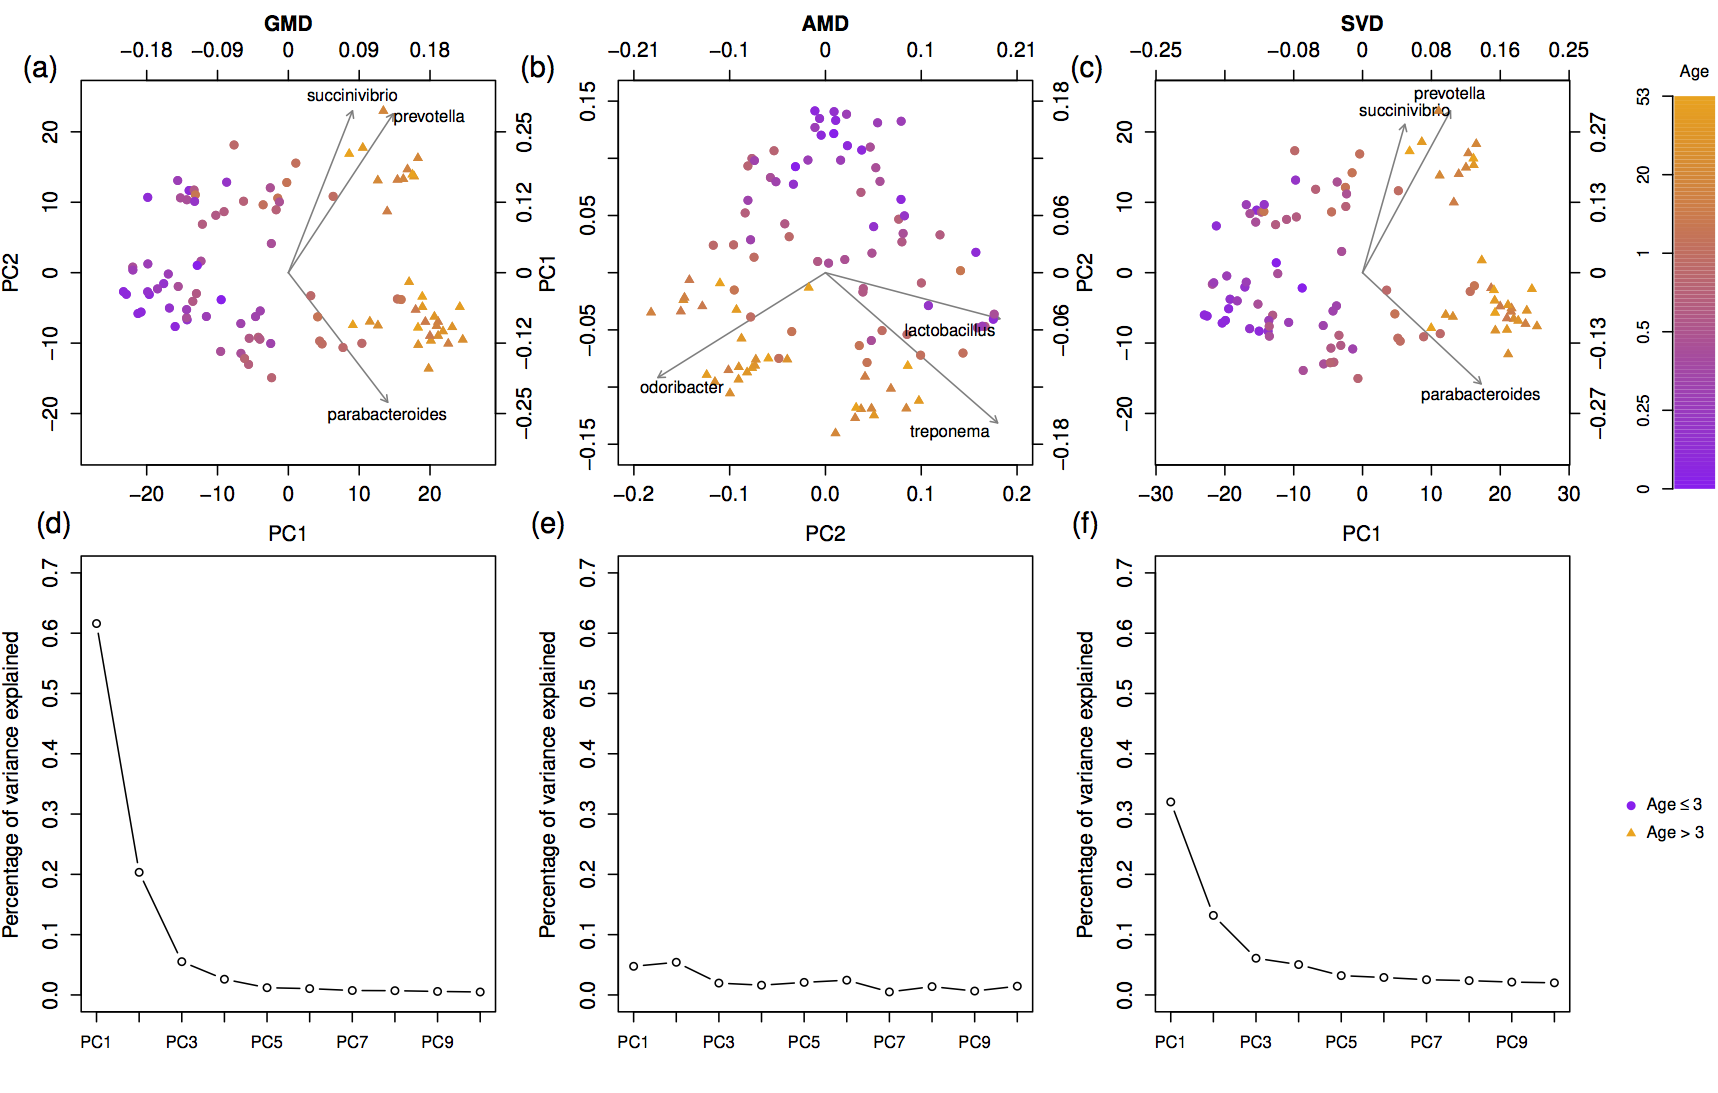
Exploratory analysis of human microbiome data is often based on dimension-reduced graphical displays derived from similarities based on non-Euclidean distances, such as UniFrac or Bray-Curtis. However, a display of this type, often referred to as the principal coordinate analysis (PCoA) plot, does not reveal which taxa are related to the observed clustering because the configuration of samples is not based on a coordinate system in which both the samples and variables can be represented. The reason is that the PCoA plot is based on the eigen-decomposition of a similarity matrix and not the singular value decomposition (SVD) of the sample-by-abundance matrix. We propose a novel biplot that is based on an extension of the SVD, called the generalized matrix decomposition (GMD), which involves an arbitrary matrix of similarities and the original matrix of variable measures, such as taxon abundances. As in a traditional biplot, points represent the samples and arrows represent the variables. The proposed GMD-biplot is illustrated by analyzing multiple real and simulated data sets which demonstrate that the GMD-biplot provides improved clustering capability and a more meaningful relationship between the arrows and the points.
Importance
Biplots that simultaneously display the sample clustering and the important taxa have gained popularity in the exploratory analysis of human microbiome data. Traditional biplots, assuming Euclidean distances between samples, are not appropriate for microbiome data, when non-Euclidean distances are used to characterize dissimilarities among microbial communities. Thus, incorporating information from non-Euclidean distances into a biplot becomes useful for graphical displays of microbiome data. The proposed GMD-biplot accounts for any arbitrary non-Euclidean distances and provides a robust and computationally efficient approach for graphical visualization of microbiome data. In addition, the proposed GMD-biplot displays both the samples and taxa with respect to the same coordinate system, which further allows the configuration of future samples.
Keywords: data visualization, clustering, dimension reduction, structured data, non-Euclidean distances